
So next time you decide to use SIP, please do keep in mind that you may not be able to realize the often quoted return of 12-15%. Please do keep in mind risks associated with any investments that you are looking to make.
If you have invested or looking to invest in a mutual fund (MF) then you must have heard of SIP or Systematic Investment Plan. A monthly SIP entails investing a fixed amount of money in an MF scheme on a specific date of the month, every month (there are weekly SIPs too). Such systematic investments may stretch across several years.
It is assumed that SIP takes emotional aspect of investment out of the equation. This would be good for volatile assets class like equity. However, longer tenors are prescribed for SIP so that one is able to take care of market ups and downs. Many advisors recommend equity SIP for 5 years plus. Equity is a volatile asset class and there is no guaranteed way to know what the return could be. However, a return of 12-15% p.a. is an often quoted figure.
We decided to test this hypothesis by taking BSE Index for almost last 27 years (Jan 1991- May 2018, source: www.bseindia.com). Assuming that daily BSE Index represents daily NAV of a hypothetical Mutual Fund and created a SIP that invested Rs 10,000 per month, for a period of 5 years.
If the index went up then the number of units bought will be lower and vice-versa. The total number of units bought over 5 year period would, in turn, be redeemed in 4 equal quarterly installments at the end of the 5 year period. For instance, if you started the SIP on 1st Jan 1991 and invested 10,000 on 1st of every month for next 5 years till Dec 1995. The total number of units bought over this period of 5 years would be divided into 4 equal parts and will be liquidated in 4 quarterly installments. That is, they would be redeemed on the 1st of March, June, September, and December of 1996. Using the investment inflows and outflows over this 6 year period, we worked out the annualized return by using XIRR function.
The next run will use start date as 2nd Jan 1991 and investments would happen on 2nd of every month till Dec 1995, followed by liquidation in 4 equal quarterly installments. The process is repeated for every single day. We have taken data until 11th May 2018 and hence the last 5-year run will have the start date of 11th May 2012. This resulted in 5,000 plus SIPs that invested for 5 years and liquidated over next 1 year.
The results showed an average return of 12.324% p.a. This looks good and it is close to what lots of pundits have been talking about.
However, the average never tells the true story. The individual returns may be distributed narrowly or broadly around the average. This spread is calculated using standard deviation. It tells us how far away the returns of each individual 5,000 plus runs are distributed from the average. The standard deviation for our exercises came to 10.5982%. Its a significantly high number.
We also looked at the maximum and minimum returns that these 5,000+ run gave us. The maximum was an impressive 41.43% p.a. and the minimum was -1.142% p.a. The minimum return is negative and hence signifies a loss.
We looked at what % of simulations had returns below 7%. That number came out to 32.53%. This implies that almost 1 in 3 cases, a SIP would have generated return lower than 7% p.a.
The next number we looked at is the % of times these returns were equal to or lower than 10%. Every other SIP run (that is 50% of the simulations) have return equal to or less than 10%.
Only 40% of the time the returns were over 12%.
This was unexpected. A 5-year SIP does not appear to be as safe as many of the advisors make you believe. There are good chances that either you would lose money or generate returns that are far lower than what you may expect.
We repeated the same analysis for 7 year, 10 year, 12 year and 15 year SIP periods using the same data set and the methodology. The results are given in the table below.
We have ignored the dividend received on the stocks that constitute the index and the management fees levied by MFs. We assume that they would cancel each other out.
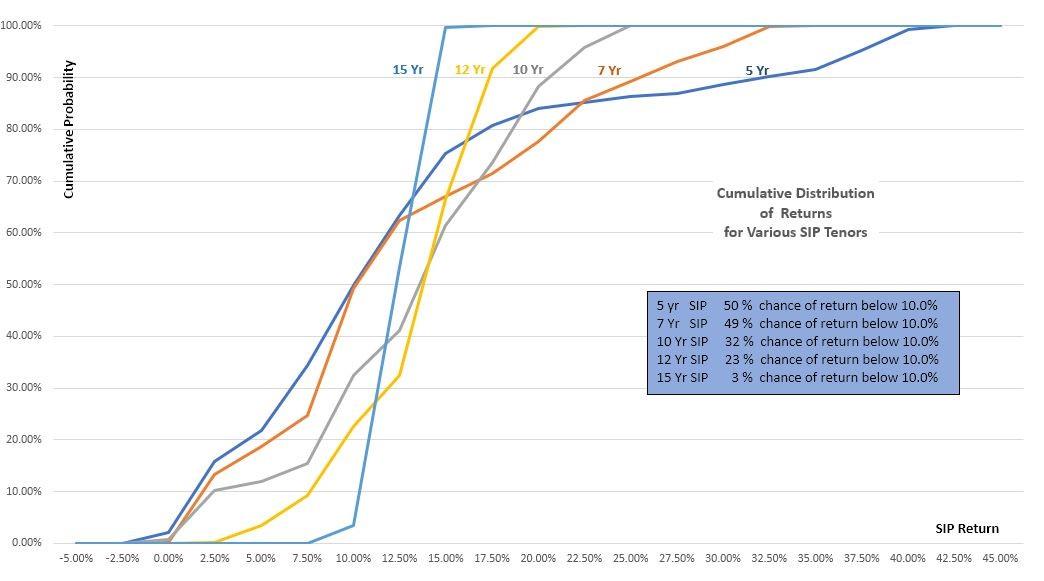
The analysis suggests that the safer SIP horizon is much higher than the often recommended 5 year period. The safer zone appears to be above 12 years, preferably 15 years.
Not only the average return increases with longer SIP period but also the standard deviation falls significantly, implying that your return is likely to be closer to the average. Minumum return improves too but the maximum return falls as both of them get closer to the average with increased SIP span.
Here is the graph that gives a cumulative distribution of returns for 5,7,10,12 and 15-year SIPs based on the historical data.
It is assumed that SIP takes emotional aspect of investment out of the equation. This would be good for volatile assets class like equity. However, longer tenors are prescribed for SIP so that one is able to take care of market ups and downs. Many advisors recommend equity SIP for 5 years plus. Equity is a volatile asset class and there is no guaranteed way to know what the return could be. However, a return of 12-15% p.a. is an often quoted figure.
We decided to test this hypothesis by taking BSE Index for almost last 27 years (Jan 1991- May 2018, source: www.bseindia.com). Assuming that daily BSE Index represents daily NAV of a hypothetical Mutual Fund and created a SIP that invested Rs 10,000 per month, for a period of 5 years.
If the index went up then the number of units bought will be lower and vice-versa. The total number of units bought over 5 year period would, in turn, be redeemed in 4 equal quarterly installments at the end of the 5 year period. For instance, if you started the SIP on 1st Jan 1991 and invested 10,000 on 1st of every month for next 5 years till Dec 1995. The total number of units bought over this period of 5 years would be divided into 4 equal parts and will be liquidated in 4 quarterly installments. That is, they would be redeemed on the 1st of March, June, September, and December of 1996. Using the investment inflows and outflows over this 6 year period, we worked out the annualized return by using XIRR function.
The next run will use start date as 2nd Jan 1991 and investments would happen on 2nd of every month till Dec 1995, followed by liquidation in 4 equal quarterly installments. The process is repeated for every single day. We have taken data until 11th May 2018 and hence the last 5-year run will have the start date of 11th May 2012. This resulted in 5,000 plus SIPs that invested for 5 years and liquidated over next 1 year.
The results showed an average return of 12.324% p.a. This looks good and it is close to what lots of pundits have been talking about.
However, the average never tells the true story. The individual returns may be distributed narrowly or broadly around the average. This spread is calculated using standard deviation. It tells us how far away the returns of each individual 5,000 plus runs are distributed from the average. The standard deviation for our exercises came to 10.5982%. Its a significantly high number.
We also looked at the maximum and minimum returns that these 5,000+ run gave us. The maximum was an impressive 41.43% p.a. and the minimum was -1.142% p.a. The minimum return is negative and hence signifies a loss.
We looked at what % of simulations had returns below 7%. That number came out to 32.53%. This implies that almost 1 in 3 cases, a SIP would have generated return lower than 7% p.a.
The next number we looked at is the % of times these returns were equal to or lower than 10%. Every other SIP run (that is 50% of the simulations) have return equal to or less than 10%.
Only 40% of the time the returns were over 12%.
This was unexpected. A 5-year SIP does not appear to be as safe as many of the advisors make you believe. There are good chances that either you would lose money or generate returns that are far lower than what you may expect.
We repeated the same analysis for 7 year, 10 year, 12 year and 15 year SIP periods using the same data set and the methodology. The results are given in the table below.
We have ignored the dividend received on the stocks that constitute the index and the management fees levied by MFs. We assume that they would cancel each other out.
The analysis suggests that the safer SIP horizon is much higher than the often recommended 5 year period. The safer zone appears to be above 12 years, preferably 15 years.
Not only the average return increases with longer SIP period but also the standard deviation falls significantly, implying that your return is likely to be closer to the average. Minumum return improves too but the maximum return falls as both of them get closer to the average with increased SIP span.
Here is the graph that gives a cumulative distribution of returns for 5,7,10,12 and 15-year SIPs based on the historical data.

SIPing Your Risk, Slowly.